Case study
Monitoring & Observability
See exactly what's happening in your applications. Real-time dashboards, searchable logs, and instant alerts so you know about problems before your users do.
Observability · DevOps & Operations · Active Service
- 15 daysData Retention
- 10+Alert Channels
- <1 secQuery Speed
01 —
What We Provide
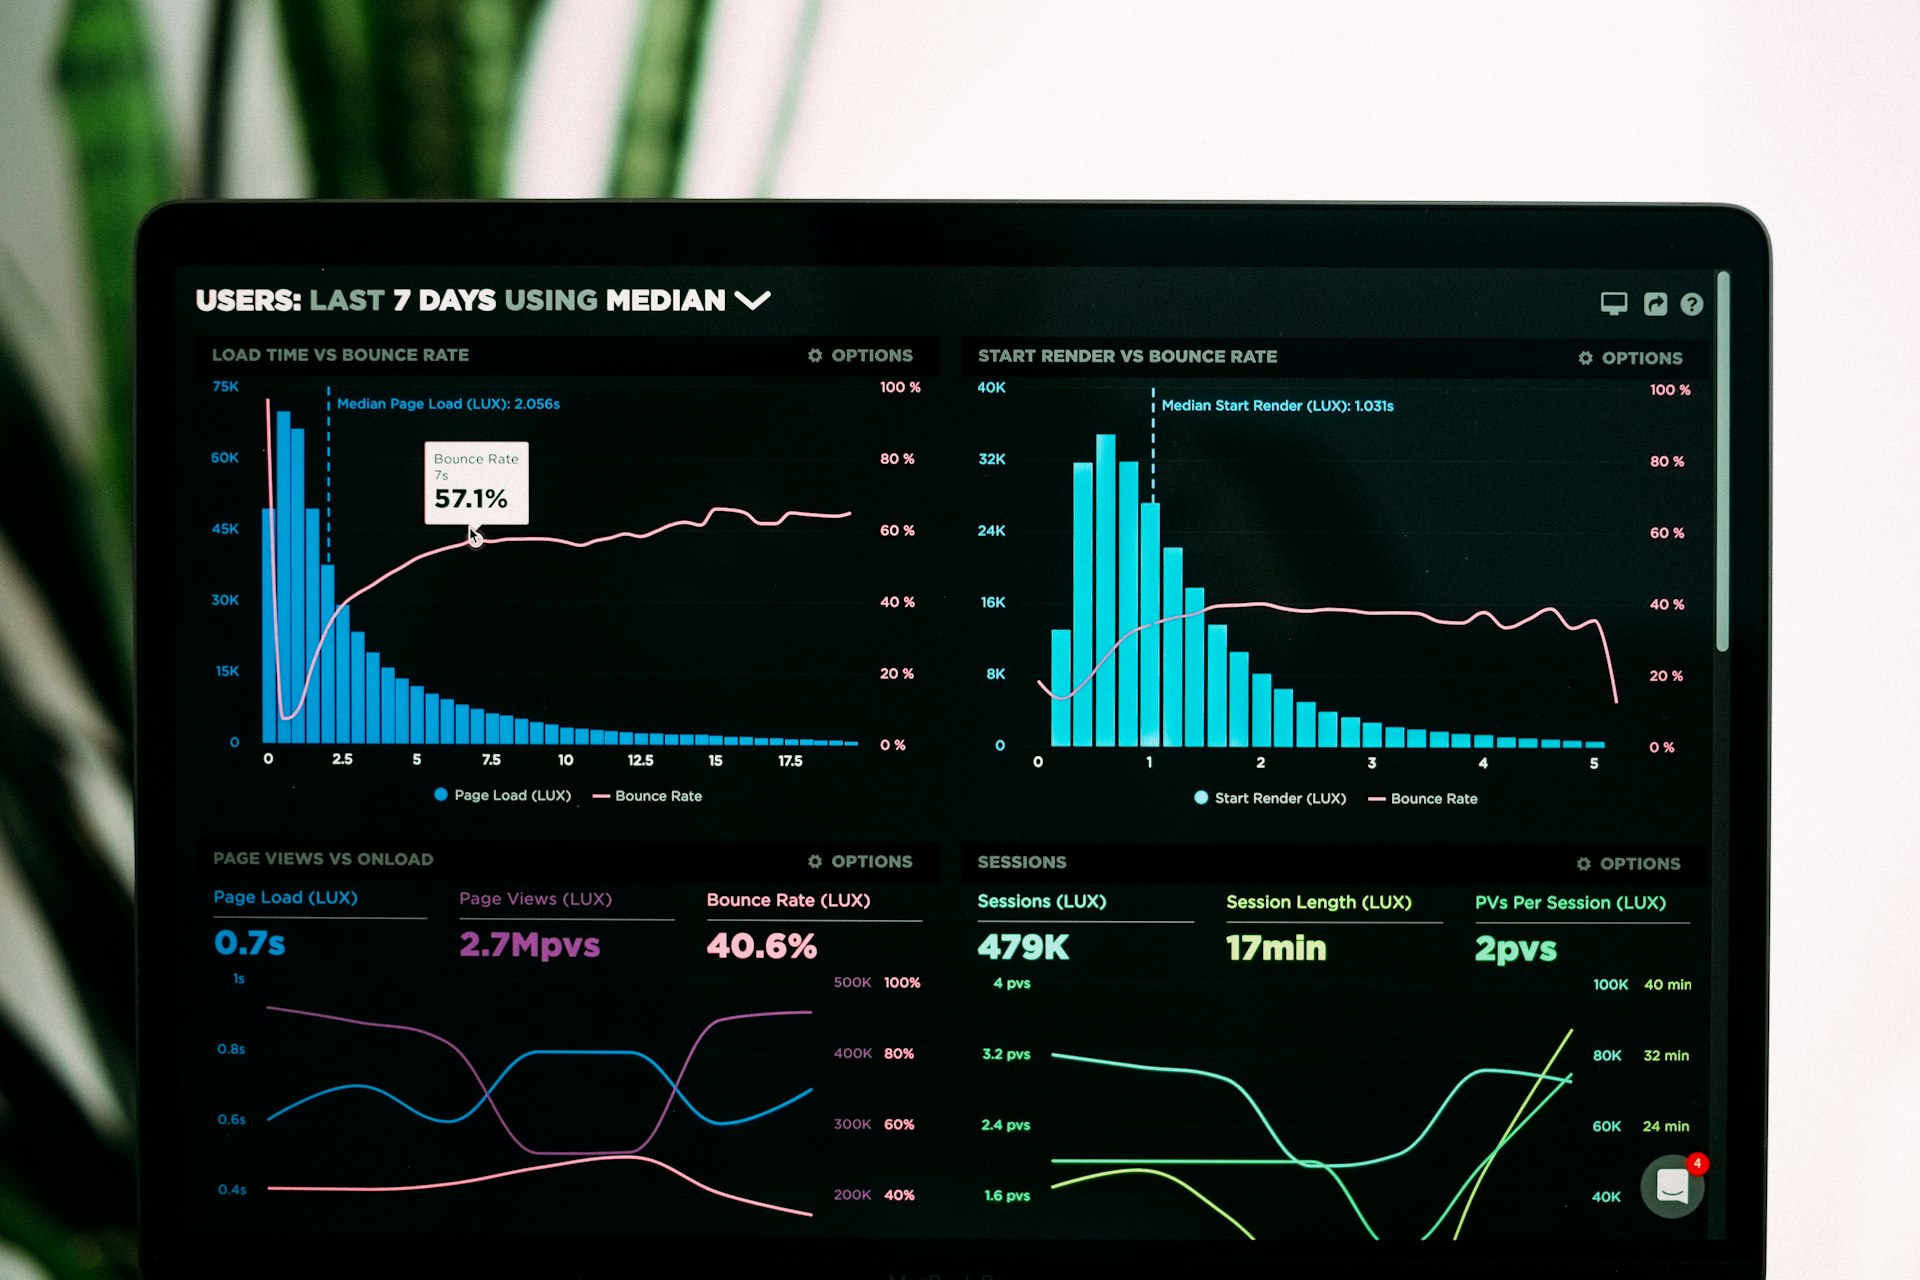
We set up complete monitoring for your applications so you always know what's happening. Real-time dashboards show you performance metrics, centralized logs let you search for any event, and intelligent alerts notify you of problems instantly.
Instead of waiting for users to report issues, you'll see problems as they happen. Slow page loads, error spikes, server issues — everything is visible in one unified dashboard that's easy to understand.
All your monitoring data is kept for 15 days, so you can investigate past incidents, compare performance over time, and spot trends before they become problems.
Key Benefits
- Know about problems before users report them
- All your logs searchable in one place
- Real-time dashboards showing live data
- Instant alerts via email, Slack, or chat
- Track performance over time
- Find the root cause of issues fast
- No impact on application performance
- 15 days of historical data
02 —
Monitoring Components
Everything you need for complete visibility into your applications.
Metrics
Performance Tracking
Real-time stats on speed and usageLogs
Centralized Logging
All activity in one searchable placeTracing
Request Tracking
Follow requests through your systemDashboards
Visual Monitoring
Charts and graphs you can understandAlerts
Instant Notifications
Get notified before users complainHistory
15-Day Retention
Look back at past issuesSearch
Log Search
Find any event in secondsSecurity
Private Access
Only your team can view
03 —
What We Monitor
Complete visibility across your entire application.
Website Performance
Page load times, response speeds, and how fast your site feels to visitors.Error Detection
Automatic detection of crashes, failed requests, and broken features.Server Health
CPU usage, memory, disk space, and connection counts on your servers.API Performance
How fast your backend responds and which endpoints are slowest.User Experience
Real user metrics showing how actual visitors experience your site.Uptime Tracking
Know immediately when your site goes down, before customers tell you.
04 —
Dashboard Features
Powerful tools presented in an easy-to-use interface.
Real-Time Metrics
See live data on requests per second, active users, and system performance.Error Rate Tracking
Instantly spot when error rates spike so you can investigate quickly.Log Search
Search through all your logs with simple queries to find exactly what happened.Request Tracing
Follow a single request through your entire system to find bottlenecks.Custom Alerts
Set up notifications via email or chat when metrics cross thresholds.Historical Analysis
Compare today to last week to spot trends and recurring issues.
05 —
Intelligent Alerting
Get notified about what matters, when it matters.
High Error Rate
Get notified when errors exceed normal levels so you can respond fast.Service Down
Immediate alert if any part of your application stops responding.Slow Response Times
Know when your site is sluggish before users start leaving.Resource Exhaustion
Warnings when servers run low on memory, disk, or CPU.Security Events
Alerts for unusual traffic patterns or potential attacks.Custom Thresholds
Define your own alert conditions based on what matters to your business.
06 —
How It Works
Three Pillars of Observability
Metrics show you what's happening, logs tell you why, and traces show you where. Together, they give you complete visibility into your applications.Unified Dashboard
All your monitoring data in one place. No switching between tools or piecing together information from different sources.Proactive Alerting
Get notified of problems before they affect users. Set thresholds based on your needs and receive alerts via email, Slack, or other channels.Zero Impact Collection
Monitoring runs alongside your applications without slowing them down. Lightweight agents collect data in the background.
Ready to see what's happening in your apps?
Stop guessing and start knowing. Get complete visibility into your applications with real-time monitoring, searchable logs, and intelligent alerts.